With support from the Northwest Climate Science Center, USGS Center for Integrated Data and Analytics, and the National Park Service, it’s my pleasure to introduce new gridded climate maps for Mt. Rainier National Park. These products are based on six years of monitoring air temperature and snow duration at hundreds of sites across Mt. Rainier using data from climate stations and low-cost distributed temperature sensors.
For the first time, MORAclim gives us a detailed picture of how the Mountain’s topography and vegetation interact with the regional climate to produce a diverse set of microclimates. This important baseline information will be used to inform research on how climate shapes Mt. Rainier’s forests, meadows, rivers, and glaciers as well as how climate change will impact these important resources. This post provides an overview of the MORAclim products, how they were developed, and what their appropriate uses and limitations are.
** Summary products have been released in draft form, and can be downloaded here.**
** Maps of selected products can be explored here.**
Why produce new climate maps for Mt. Rainier?
When I started my dissertation work at Mt. Rainier National Park in 2012, I started to look at how climate measurements from my lab’s field sites lined up with the existing best-in-class gridded climate products. What I found was striking: the existing, relatively coarse-scale maps from PRISM and other sources didn’t match my ground-based measurements of air temperature very well at all. In some cases these products had seasonal biases of up to 4 degrees C! Because my research involves how climate affects plant populations and geographic distributions, these biases pose large problems for me and other researchers who are trying to forecast the impacts of climate change on ecosystems and other park resources.
The root cause of the problems in the existing climate maps are not a mystery: it takes a dense network of well-maintained climate stations to represent climate in complex terrain like the Cascades, and climate stations in the region are relatively few and far between. Furthermore, traditional weather stations are located in environments where the equipment is relatively easy to access and maintain. This means that most of these stations are located in open fields near roads and other infrastructure. This is a particular challenge at Mt. Rainier National Park, where the rugged topography and dense forests cause local climates to diverge from regional conditions in sometimes striking ways.
In 2015, I was lucky to receive funding from the Northwest Climate Science Center to address the problems I identified and develop a new set of climate products which I came to call “MORAclim”.
MORAclim Methodology
The data
The base data that I used to build the MORAclim products are measurements from a network of air temperature and snow duration sensors installed and maintained by the HilleRisLambers lab at the University of Washington. This station network, initiated in 2008, has grown to more than 100 sites for air temperature, and more than 400 sites for snow duration (see Ford et al. 2013 for an early description of the station network). Air temperature at each station was measured every two hours at a height of 4-5m above the ground surface (above the typical level of the winter snowpack at Mt. Rainier) using low-cost data logging temperature sensors. These sensors were suspended from conifer tree branches under inverted white plastic funnels, with both the funnel and surrounding vegetation serving as radiation shields. Snow duration was measured using similar sensors attached to the soil surface. We also incorporated data from traditional weather stations in the vicinity of Mt. Rainier operated by the National Park Service, National Weather Service, USDA SNOTEL program, and the Northwest Avalanche Center. Data from each station and sensor was subject to a rigorous quality control algorithm, and quality-controlled measurements were used to compute daily average, minimum, and maximum temperatures for each station.
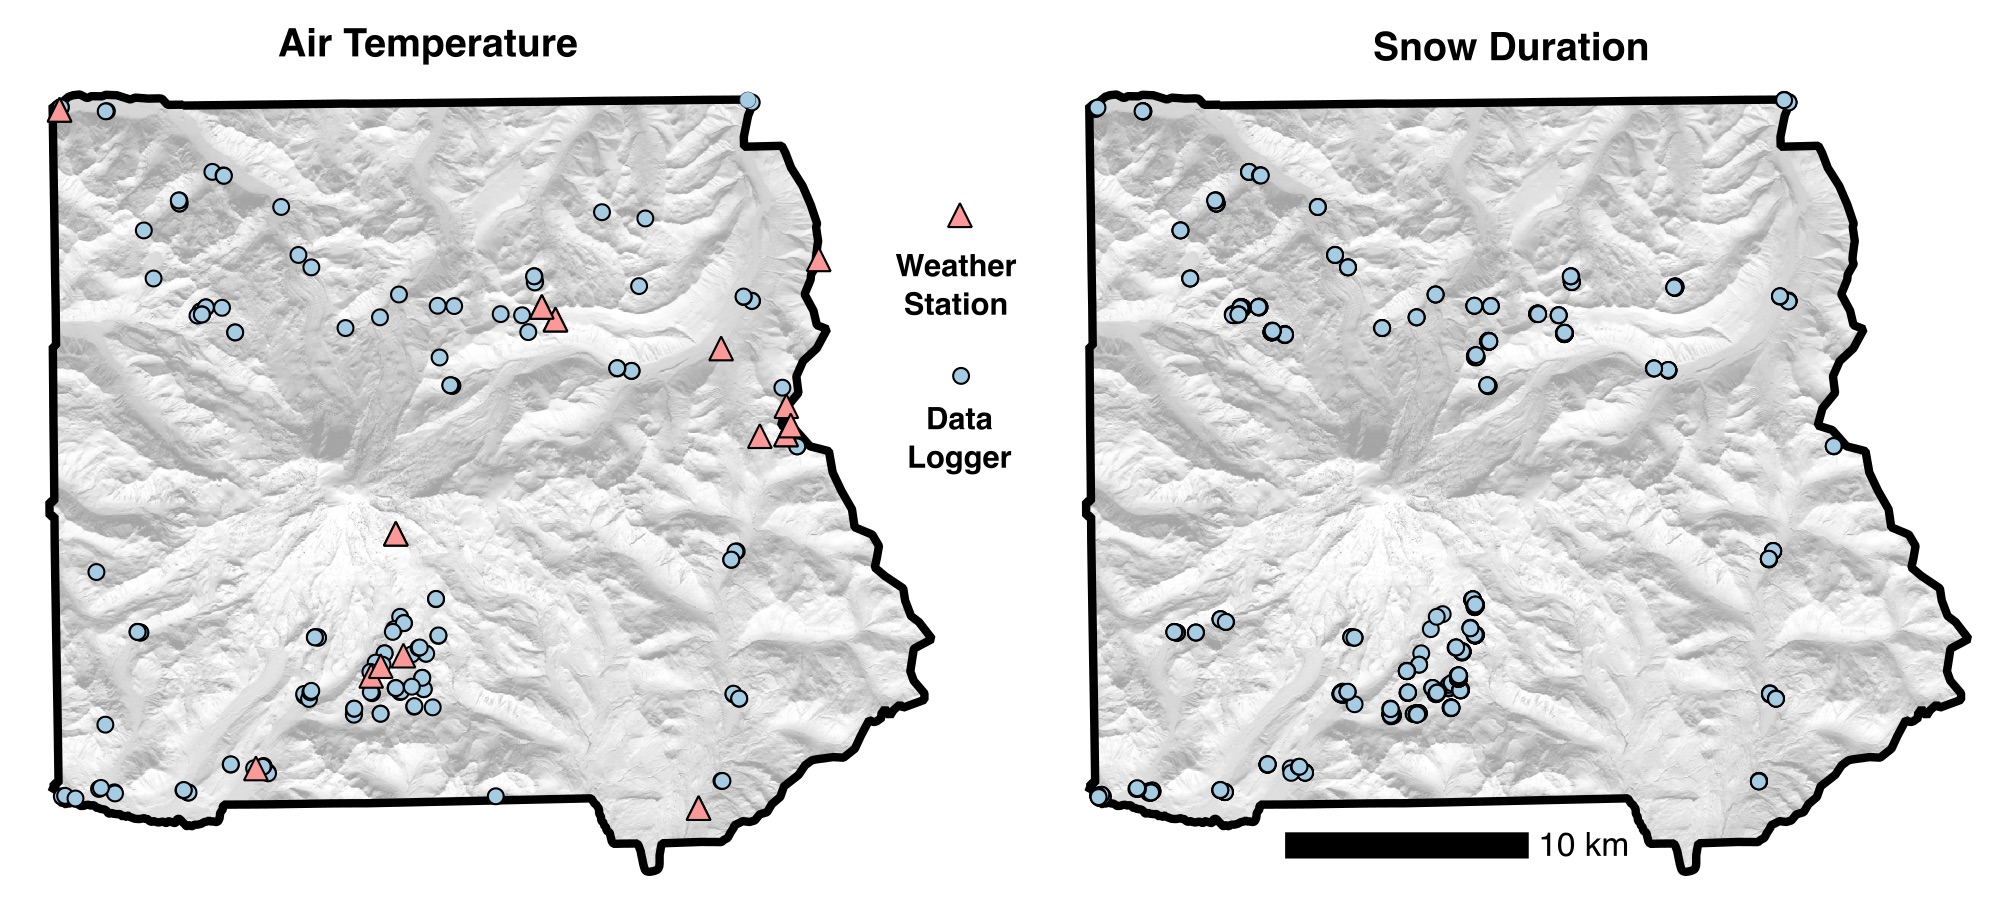
Locations of sensors used to build MORAclim.
Modeling Approach
Using the daily observations from weather stations and distributed sensors as base data, I extrapolated air temperature measurements across Mt. Rainier National Park using a statistical model. My approach breaks the daily measurements down into two parts: a deterministic component that varies predictably by season, and a stochastic component that varies daily, but has a overall long-term mean of zero. We used a relatively complex model for the deterministic component (which we fit only once for every season) and a relatively simple model for the stochastic component, which we need to fit for every day from September 1st 2009 to August 31st 2015. Estimating and mapping these two parts separately allowed me to account for the diverse sources of variation in microclimate at Mt. Rainier while reducing the errors associated with overfitting sparse data.
In the first stage of the analysis, we estimated the mean linear relationship between quality-controlled measurements at each station in our sensor network and a series of daily regional average conditions extracted from PRISM. We estimated two components of this local-regional relationship for each sensor in each of four seasons:
The linear regression intercept, which indicates relatively how warm or cold a local site is relative to the region under typical conditions and
The linear regression slope, which indicates how sensitive microclimates at a given site are to changes in regional conditions.
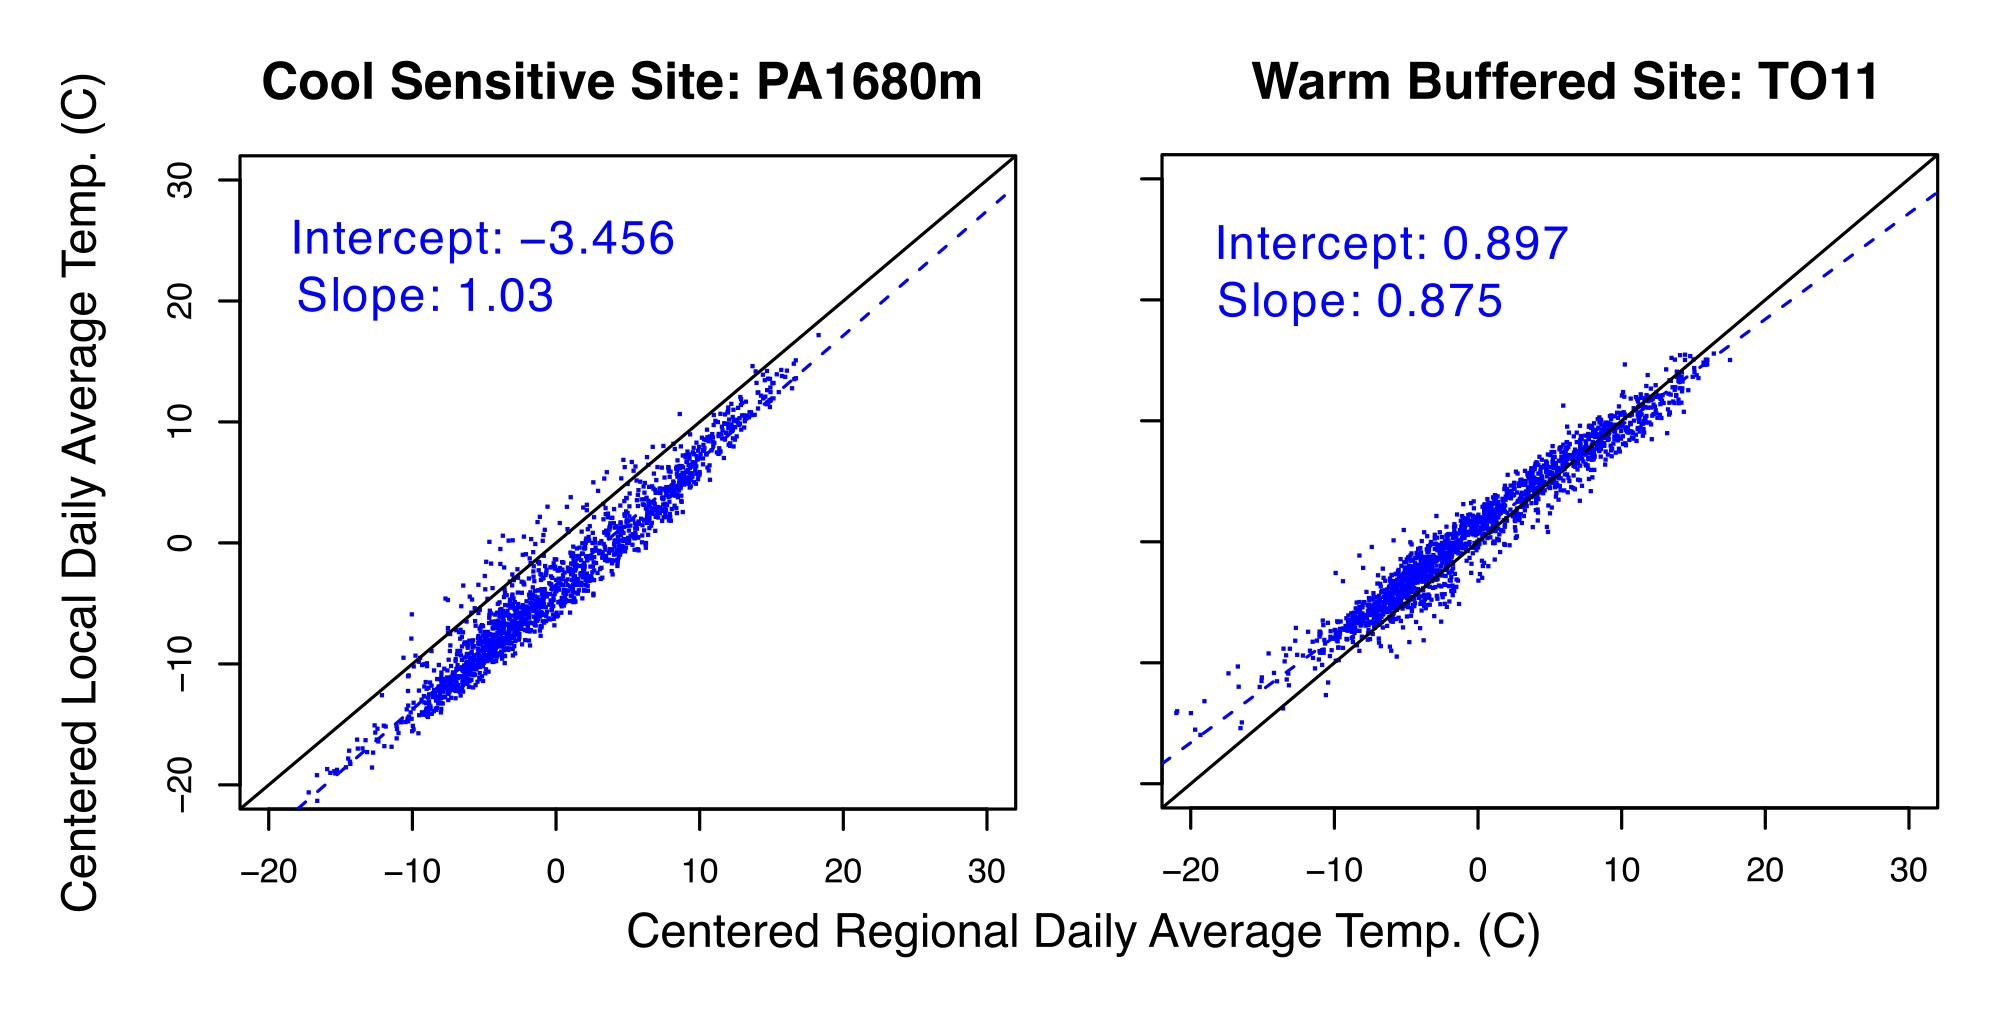
Local-regional regressions for two representative sites.
I found that both of these components of the local-regional relationship were highly predictable based on the characteristics of the site. Stations at high elevations were predictably cooler than stations at lower elevations, for example, and west-slope locations were predictably less sensitive to regional temperature changes than east-slope locations. In fact, we found that between 75 and 95% of the variation in these relationships could be accounted for by factors such as elevation, canopy volume, insolation and relative slope position. Based on these relationships, we used generalized additive models to predict local-regional slopes and intercepts for each location at Mt. Rainier National Park for each season: Winter (December—February), Spring (March – May), Summer (June – August), and Fall (September – November), and from there produced an expected value for each location on each day based on the season, site attributes, and the regional average conditions for that day.
In the second stage of the analysis, we used a geostatistical approach called Bayesian Kriging to predict departures from expected conditions for each day, often referred to as “anomalies”. These anomalies are caused by local factors such as cloud cover, precipitation, or cold-air pooling. There are lots of different ways to extrapolate these kinds of local adjustments across space, but we selected a relatively new method called Bayesian Kriging for this analysis. This method has the advantage of being able to include covariates such as elevation as well as specify “prior information” in the model that causes estimates to be more robust on days where we have relatively few measurements.
Validation
No model gives perfect predictions, and any complex analysis involves many subjective decisions that can introduce bias into prediction and inference. To assess how well MORAclim performs, we compared our model’s predictions to measurements from 20 randomly-selected climate stations that we deliberately excluded from the analysis. We found that the MORAclim products perform well, with substantially reduced error and minimal bias compared with the data products that are currently available. Seasonal mean estimates of minimum and average temperatures have average absolute errors of less than 1 degree C for all seasons, while daily maximums had absolute errors between 1 and 1.5 degrees C. These statistics compare favorably to other recent efforts to model microclimates in mountainous locations, and are a substantial improvement over national state-of-the-art products PRISM and TopoWX.
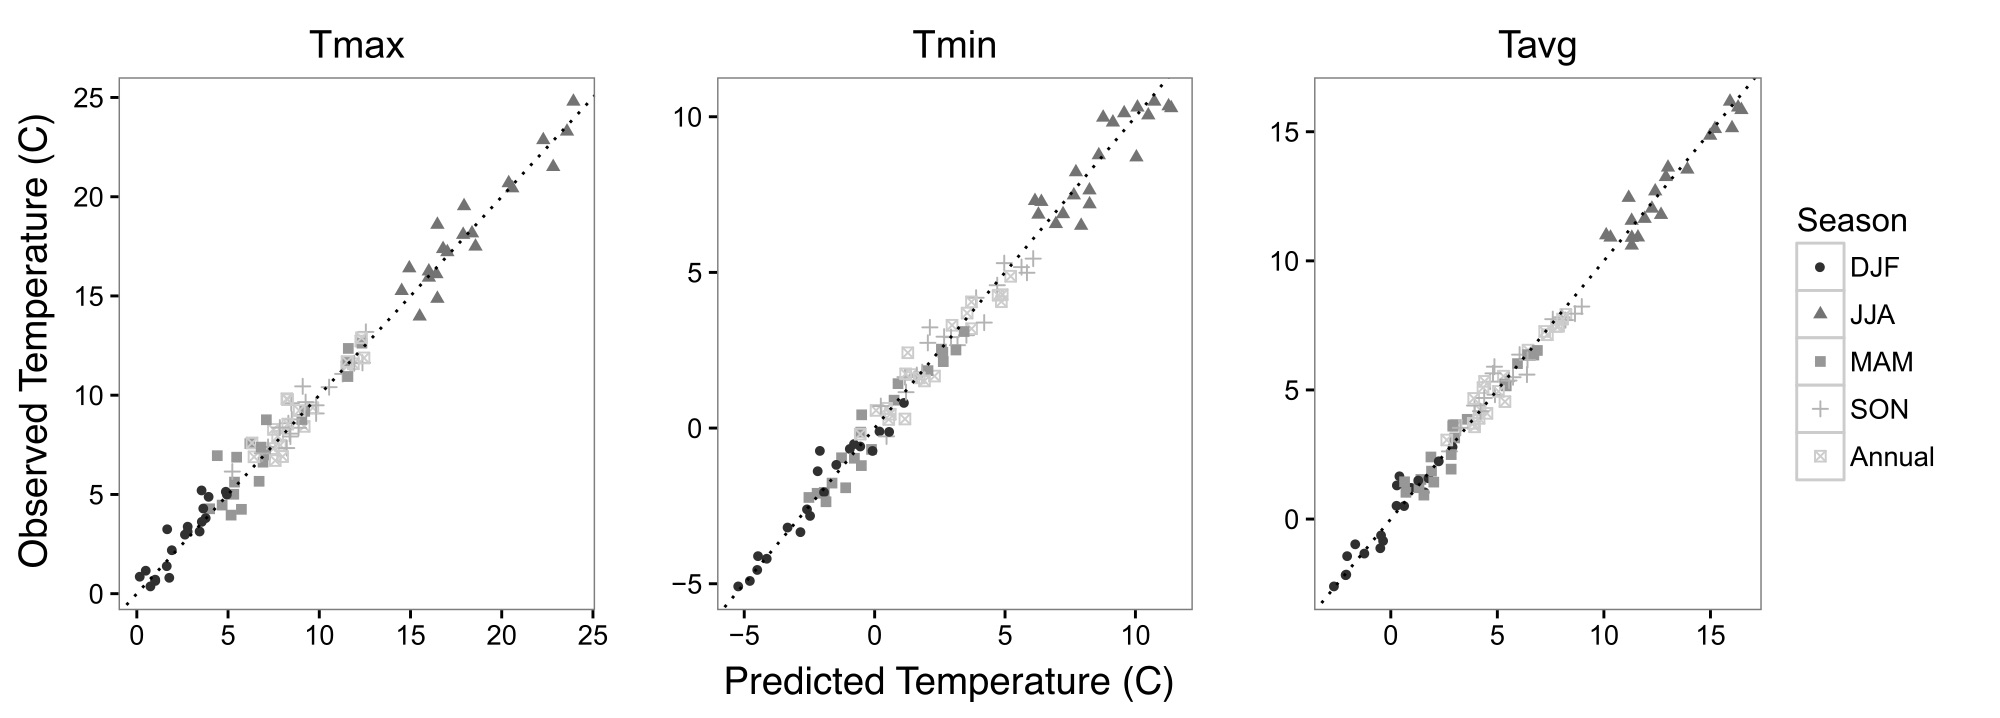
Observed vs. predicted values for seasonal and annual temperature means.
The Products
MORAclim version 0.9 consists of four different types of climate products, each of which has it’s own strengths and limitations. All products are delivered as georeferenced raster images with NAD83 Datum, UTM Zone 10N projection, and 90m grid resolution.
Air temperature summaries
This dataset consists of statistical summaries of daily average air temperature, daily minimum air temperature, and daily maximum air temperature for each season (Winter-DJF, Spring-MAM, Summer-JJA, and Fall-SON) and annually, over the period of the study (September 1st 2009 – September 1st 2015). Summaries include the mean, standard deviation, upper and lower quartiles, and temperature extremes (5th and 95th quantiles). The extent of the data includes all of the main parcel of Mt. Rainier National Park and extends 90m beyond the park boundary.
Limitations—Coverage of air temperature sensors is limited above 2000m, and nonexistent above 3300m, so there is relatively high uncertainty about conditions near the summit of Mt. Rainier. Furthermore, MORAclim estimates of extreme temperatures are inherently less certain than estimates for means, but this error is difficult to quantify.
Snow cover summaries
This dataset consists of gridded estimates of snow duration and last snow date during water years 2010 to 2015. This dataset represents a simple geostatistical prediction of snow cover probability for each day based on measurements at ~430 snow duration sensors distributed throughout Mt. Rainier National Park. This analysis uses GIS-based topographic and vegetation structure covariates to improve the predictions.
Limitations—Coverage of snow duration sensors is limited above 1900m and is nonexistent above 2200m elevation, so there is high uncertainty about snow cover duration, first and last snow dates at high elevations. Snow duration sensors were not placed on cliffs or rock outcrops, so snow duration is likely overestimated for these topographic features that shed snow.
Growing and freezing degree-day summaries
This dataset consists of gridded estimates of average cumulative degree-days and snow-free cumulative degree-days (temperature sums) during the growing season (April 1 – November 1) for 2009 – 2015. A base temperature of 5 degrees C was used for growing degree days. Freezing degree-day summaries are calculated in a similar fashion, with sums accumulating if daily minimum temperatures drop below 0C. The snow-free growing-degree and freezing-degree day products are generated by muliplying the daily temperature sum by the probability that each location was not covered by snow (i.e. air temperature sums accumulate half as quickly for days where the probability of snow cover is 0.5, and do not accumulate if the probability of snow cover is 1).
Limitations—Growing-degree and freezing-degree day calculations are dependent on daily temperature and snow cover time-series that were estimated using air temperature and snow duration data from stations between 500 and 3300m elevation. Extrapolation errors are likely to be high at high elevations. Snow duration sensors were not placed on cliffs or rock outcrops, so snow duration is likely overestimated for these topographic features that shed snow.
First and last freeze date summaries
This dataset consists of gridded estimates of the average dates last frost from 2009 to 2015 and average dates of first frost from 2009 to 2014. Dates are recorded as day-of-year. First frost dates were not calculated for fall of 2015 because the temperature data only runs through August 30th, 2015. Frost dates are the first or last days of the calendar year where daily mimimum air temperatures (measured 4-5m above the ground) fall below 0 degrees C.
Limitations—First and last frost dates were directly calculated from daily temperature time-series, and share all of the limitations of those products, particularly a lack of data above 3300m elevation. Extrapolation errors are likely to be high at higher elevations.
The road ahead
MORAclim is a draft product released to the public and the community for testing and evaluation. It should not be used for mission-critical scientific or other work at this point. After an initial round of review (and manuscript submission), these products will be finalized, along with the daily time-series that were used to build the summary products. These data are too large to host here, but will eventually find their way to the Center for Integrated Data Analytics at USGS.
If you identify any problems, or would like to use these products in an ongoing project, drop me a line at ian_breckheimer@fas.harvard.edu.